Identify the observation.
Record its date, location, indicator and stated uncertainty. Keep a link or export of the original output rather than just a cropped screenshot.
By Fieldnote editorial · Checked 26 October 2026 · Independent of FarmBot Tech
Understand FarmBot Tech’s planned Pixxel satellite integration and the questions to ask about delivery. The imagery primer explains background concepts, not currently verified account features.
The launch announcement places the Pixxel integration after the early voice-AI release.
Its first applications were planned for Q4 2026. Treat that as a statement of intent from 22 October, and ask what is actually enabled for an account today.
Read the FarmBot Tech announcement ↗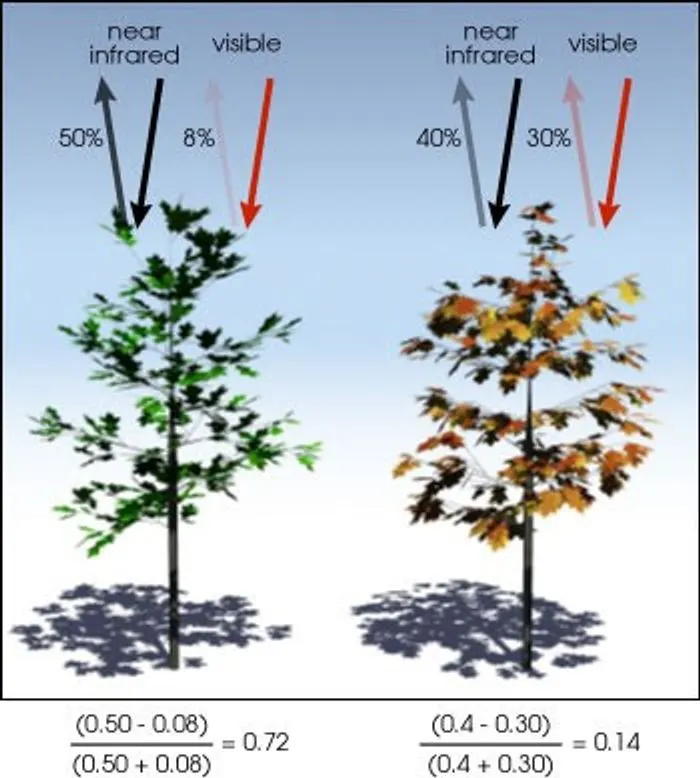
A visible-light image gives you a recognizable view of a field. A drone photograph like the ones in this guide is not a FarmBot Tech analysis or a delivered satellite product.
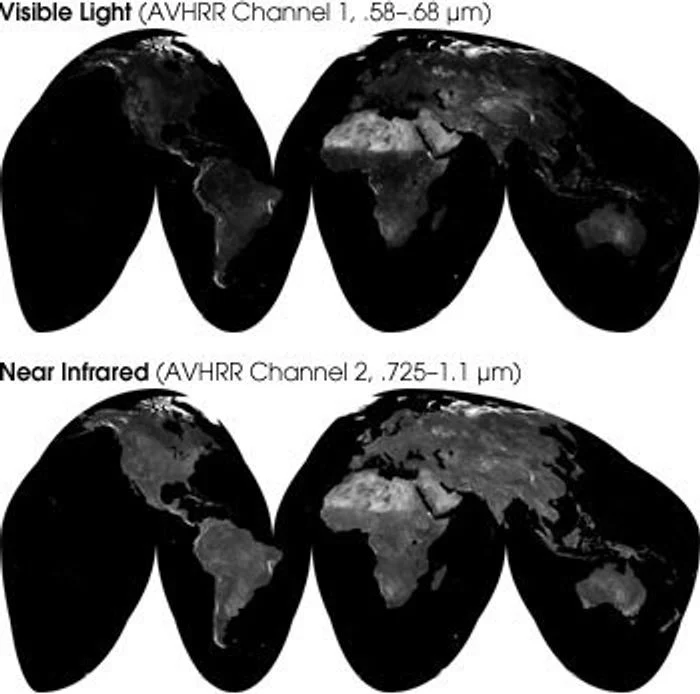
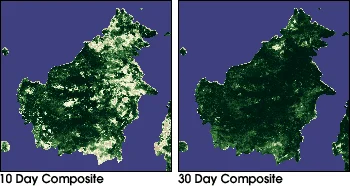
NASA explains NDVI as a comparison of reflected visible and near-infrared light used to describe green vegetation. Leaves absorb and reflect these wavelengths differently.
Pixxel describes hyperspectral sensing as measuring many narrow spectral bands, compared with fewer, broader multispectral bands. More spectral detail is not a guarantee of a useful recommendation for a particular field.
NASA notes that clouds, aerosols, glare and instrument issues can limit optical vegetation observations. Satellite revisit frequency is not the same as the frequency of usable field data.
Background sources: NASA vegetation-index explainer ↗ · Pixxel spectral-imaging explainer ↗. This primer does not establish which indices or sensors FarmBot Tech currently supplies.
| Ask for this | Why it matters | A useful follow-up |
|---|---|---|
| Acquisition date | The date the field was observed may differ from the date a report was generated. | When was the observation captured, processed and delivered? |
| Area and boundary | You need to know which part of the field an output represents. | Can I inspect the boundary and excluded areas? |
| Resolution | A pixel summarizes an area, not an individual plant. | What area does each measurement represent in this delivered product? |
| Quality information | A visually complete map may still include uncertain or missing observations. | How are clouds, missing values and confidence shown? |
| Reference period | A change only makes sense relative to a stated comparison. | Is this compared with the previous observation, the season or a historical baseline? |
| Ground verification | An observation does not by itself prove its cause. | What should a qualified person check before taking action? |
Record its date, location, indicator and stated uncertainty. Keep a link or export of the original output rather than just a cropped screenshot.
Review what is already known about that area and ask an appropriately qualified person how to verify the observation. Do not infer an input rate or treatment from a color alone.
Keep the observation, the verification and the resulting decision as separate entries. That makes it possible to review later what information actually informed the action.
No. Ask the provider to confirm your region, field boundaries, current crop or production coverage and the specific output included in your quote.
A vegetation index describes a measured pattern. Ask what additional evidence supports an interpretation and how it should be checked on the ground.
Check the acquisition date and what has changed since that observation. Ask the provider how it flags stale observations and missing updates.
No. They are credited context photographs. They do not show FarmBot Tech output, customer results or the availability of its planned integration.